Imagine a robot inspecting dark buttons on a bright table. A fixed threshold works today, but tomorrow the camera exposure shifts slightly and every intensity moves. The scene still contains two visual populations—button and table—yet the best dividing number has changed. Otsu’s method asks the current histogram to choose that number.
1. What is Otsu Thresholding?
Otsu thresholding is an automatic global-threshold algorithm that chooses the intensity split with the greatest statistical separation between two classes. It solves binary segmentation when foreground and background form distinguishable populations but their absolute brightness can vary between images.
The method was introduced by Nobuyuki Otsu in 1979. It is nonparametric and unsupervised: it does not fit a learned model or require labeled examples. It uses only the gray-level histogram of the current image.
1.1 The Complete Otsu Pipeline
Histogram → maximum class separation → mask
Otsu searches for the threshold that makes the two intensity classes maximally separable, which is most convincing when the histogram contains two meaningful populations.
Otsu begins with the same goal as manual thresholding: choose one brightness value that divides foreground from background. The difference is that the engineer does not type that value. The algorithm estimates it from the image’s gray-level histogram.
The histogram forgets where pixels are and simply counts how often each intensity occurs. Otsu tries every possible place to split those counts into a darker group and a brighter group. For each candidate, it asks whether the two groups are internally compact and well separated from one another.
The candidate producing the strongest statistical separation becomes the threshold. The image then passes through ordinary global thresholding: every pixel below the cutoff receives one label and every pixel above it receives the other.
This means Otsu automates only the choice of cutoff. It does not understand objects, uneven illumination, or connectivity. It works best when the histogram really can be explained as two intensity populations, which the following sections make precise.
1.2 Turn the Image Into a Probability Distribution
For an image with possible intensity levels, let be the number of pixels at level , and let be the total number of pixels. The normalized histogram is
is the probability that a randomly selected pixel has intensity , and the probabilities sum to one. Spatial location disappears: two images with the same histogram produce the same Otsu threshold even if their pixels are arranged very differently.
1.3 Split the Histogram Into Two Candidate Classes
For a candidate threshold , class contains levels through , while class contains through . Their probabilities are
and are the fractions of pixels assigned to the two classes. Their means are
and describe the average gray level on each side. Candidate thresholds producing an empty class are invalid because their class mean is undefined.
1.4 The Objective: Maximize Between-Class Variance
Otsu scores the split with
is the between-class variance. The squared mean difference rewards classes that are far apart, while prevents a tiny outlier class from winning merely because its mean is distant. The selected threshold is
is the candidate threshold with maximum separation. Otsu’s paper also shows the equivalent view: minimizing weighted within-class variance. The total histogram variance is fixed, so maximizing variance between classes leaves less variance within them.
Interactive Otsu objective
Change the class overlap and find the strongest separation
Intensity histogram
Objective for every candidate threshold
1.5 Why a Bimodal Histogram Helps
Picture two peaks: dark parts on the left and a bright table on the right. A threshold in the valley produces two compact classes with distant means. Between-class variance becomes large.
If the histogram is broad and unimodal, the two-class story is weaker. Otsu will still return a number because the optimization is defined, but that number may not correspond to a physical boundary. An automatic answer is not evidence that the image contains two meaningful objects or materials.
Class imbalance also matters. A tiny defect on a large background may contribute too few pixels to form a strong second population. Texture can create multiple peaks unrelated to the desired foreground. Blur fills the valley with transition pixels. Always compare the statistical split with the task semantics.
1.6 Otsu Still Uses One Global Threshold
Automatic does not mean local. If the right side of the frame is shadowed, foreground and background intensities may overlap even though the full-image histogram has two peaks. Otsu chooses one compromise threshold and can fail in both regions.
Local or adaptive thresholding handles spatial illumination changes. Alternatively, crop to a region of interest before Otsu so irrelevant background does not dominate the histogram. This can be especially valuable when the robot already knows approximately where the inspection feature should appear.
1.7 Is the Objective a Loss Function?
Otsu has an optimization criterion but no learned weights. It scans candidate thresholds in the current histogram and maximizes . Calling this a training loss would be misleading because there is no training phase or dataset-level parameter update.
For deployment evaluation, use labeled images. A threshold objective measures histogram separation, not task accuracy. Report mask IoU, precision, recall, connected-component count, and final inspection error under each permitted imaging condition.
1.8 Otsu Versus Manual and Local Thresholding
| Method | How is chosen | Best fit | Main weakness |
|---|---|---|---|
| Manual global | Engineer calibrates one value | Stable, controlled imaging | Does not adapt between frames |
| Otsu global | Maximizes class separation per image | Two meaningful intensity populations | One cutoff; sensitive to histogram composition |
| Yen global | Maximizes a probability-concentration criterion | Alternative histogram shapes | Still one cutoff and two-class assumption |
| Local/adaptive | Computes neighborhood-dependent cutoffs | Uneven illumination | More parameters and local noise sensitivity |
Choose based on the source of variation. If the whole histogram shifts together, automatic global thresholding can help. If illumination varies within a frame, selecting a different global number cannot solve the geometry of that variation.
1.9 A Reliable Robotics Workflow
Lock camera controls where possible. Convert to a deliberate grayscale representation. Limit the region of interest to task-relevant pixels. Plot histograms from successful and failed scenes. Then compare Otsu against a fixed threshold on held-out images.
After thresholding, clean only the artifacts the task permits. Morphological opening removes small specks but can erase small defects. Closing bridges gaps but can merge adjacent parts. Connected components and contours transform the pixel mask into candidates, while calibration transforms their positions into robot coordinates.
Monitor the selected threshold over time even if the Skill returns only the label map. Large mask-area or component-count changes can reveal lamp failure, lens contamination, or exposure drift. An automatic method should be observable, not trusted invisibly.
1.10 Why Maximizing Separation Minimizes Within-Class Spread
Otsu’s equivalence becomes clearer by decomposing total variance. Let the global mean be
is fixed for one image. The total variance can be decomposed into within-class and between-class terms:
is the weighted variance remaining inside the two candidate classes, while measures their separation. Because does not change as moves, maximizing necessarily minimizes . The algorithm is looking for two internally compact groups that are externally far apart.
This interpretation also exposes a failure. A textured foreground may have large internal variance even when it is semantically one object. Otsu can split that texture instead of separating foreground from background because intensity compactness—not object identity—is the objective.
1.11 Preprocessing Changes the Histogram Problem
Gaussian blur suppresses noise and can create smoother peaks, but it also introduces intermediate intensities along boundaries. Contrast enhancement spreads intensities and may deepen a histogram valley, while clipping can pile many pixels into the endpoints. Cropping changes the class proportions and . Every preprocessing step therefore changes the optimization, sometimes more than switching threshold algorithms.
Use preprocessing deliberately. If the objective is part counting, moderate denoising may stabilize components. If the objective is measuring a one-pixel burr, the same filter may erase the evidence. Document the exact operation order: crop, grayscale conversion, filtering, thresholding, morphology, and component analysis.
Color-to-gray conversion deserves special attention. A red object and green background can have similar luma and collapse into one histogram peak despite being easy to separate in color. In that situation, Otsu is not failing; the grayscale representation discarded the useful distinction.
1.12 Diagnose Otsu With More Than the Final Mask
During commissioning, save the histogram, chosen threshold, class weights, class means, and maximum between-class variance. A threshold near an intensity endpoint may indicate a tiny outlier class. A very small maximum separation score may indicate that the two-class model is weak. A sudden threshold shift can reveal a camera-setting change.
Also test transformed cases. Add realistic brightness offsets, contrast changes, blur, and sensor noise to validation images. Otsu should adapt to a global brightness shift, but its mask may change under contrast compression because the classes overlap more. These controlled perturbations help distinguish algorithmic sensitivity from random field failures.
Finally, establish a no-decision path. If foreground fraction, separation score, or downstream shape checks fall outside validated ranges, stop or request another observation. An automatically selected threshold is a proposal, not an obligation to move the robot.
1.13 What Otsu Does With Unequal Class Sizes
The factor is largest when the two classes contain similar pixel counts and becomes small when one class is tiny. This does not force a 50–50 split, but it means a rare foreground must provide strong mean separation to influence the objective.
Consider one small black screw on a large white table. The screw may occupy less than one percent of the image. Cropping around the expected fixture increases its histogram weight without altering its pixels, often making the desired split clearer. This is a principled reason to use task geometry before histogram analysis.
Do not crop so tightly that the background reference disappears. Otsu needs evidence from both intended classes. A region containing only the screw surface still receives a threshold, but that threshold may split texture within the screw rather than screw from table.
Class size is therefore part of the input distribution. When comparing experiments, keep the region of interest fixed and report foreground fraction. Otherwise an apparent algorithm improvement may come only from changing how many target and background pixels entered the histogram.
2. How to Use Otsu Thresholding in the Telekinesis Agentic OS
Telekinesis provides Otsu’s method as the Cornea Skill segment_image_using_otsu_threshold. The Skill takes only the image; the threshold is calculated from its intensity histogram.
from telekinesis import cornea, datatypes

image = datatypes.Image.from_url(
    url="https://assets.telekinesis.ai/examples/v1/images/buttons_arranged.jpg"
)

mask = cornea.segment_image_using_otsu_threshold(image=image)

print(mask.shape)
print(mask.label_codes)
print(mask.number_of_labels)
The returned SegmentationImage separates pixels above and below the automatically chosen global threshold. Inspect which label corresponds to the physical target before using the mask downstream.
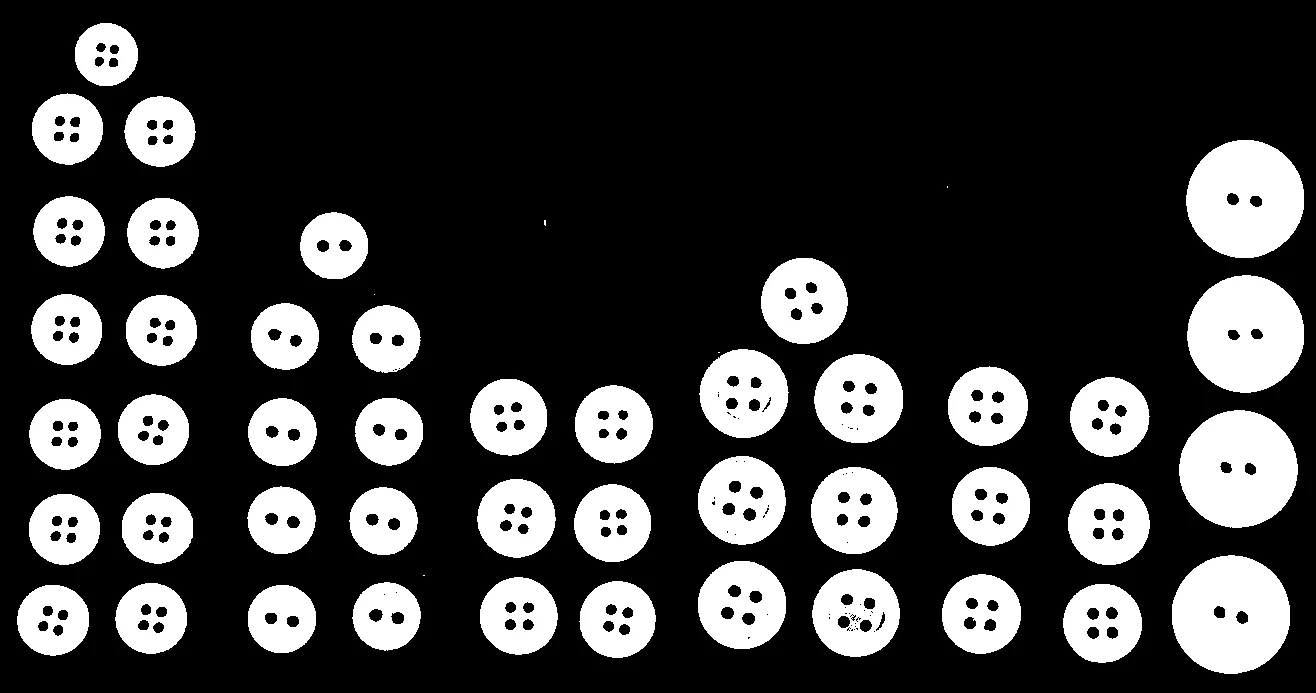
Otsu optimizes histogram separation. Whether the resulting labels mean “button” and “table” must be established by the application.
3. Benchmarking
The original paper demonstrates threshold selection on several gray-level histograms and derives an efficient cumulative calculation, rather than reporting modern segmentation benchmarks. For your robot, compare Otsu with manual and Yen thresholds on identical labeled frames. Report IoU and task errors by lighting condition, foreground fraction, contrast, blur, and texture. Include empty-target scenes: a method that always returns two classes can still invent a meaningless foreground.
4. Where to Go Next?
 Basic · 11 min read
What is Image Thresholding?
Image thresholding solves the problem of separating pixels with a known intensity cutoff. Learn the comparison modes, histogram reasoning, failure cases, evaluation metrics, and how to use global thresholding in the Telekinesis Agentic OS.
Read tutorial → Intermediate · 11 min read
What is Yen Thresholding?
Yen thresholding solves the problem of selecting one global intensity cutoff automatically with a probability-concentration criterion. Learn its histogram objective, difference from Otsu, limitations, and how to use it in the Telekinesis Agentic OS.
Read tutorial → Basic · 12 min read
What is Flood Fill Segmentation?
Flood fill segmentation solves the problem of extracting one connected, visually similar region from a known interior point. Learn seed-based region growing, tolerance and connectivity, failure modes, and how to use it in the Telekinesis Agentic OS.
Read tutorial → Basic · 13 min read
What is Contour Detection?
Contour detection solves the problem of recovering the exact outline of a foreground region by tracing an ordered boundary through a binary image. Learn how contour detection works, how contours are measured, and how to use it in the Telekinesis Agentic OS.
Read tutorial →5. References
- Otsu, N. “A Threshold Selection Method from Gray-Level Histograms”, IEEE Transactions on Systems, Man, and Cybernetics, 1979.
- Sezgin, M., and Sankur, B. “Survey over Image Thresholding Techniques and Quantitative Performance Evaluation”, Journal of Electronic Imaging, 2004.
- Telekinesis. “Segment Image Using Otsu Threshold”, Cornea Skill documentation.